Overview of Graph Indicators
In Surveyor, the Indicators window can be used to show Liquidity Curves, Spread, and Position, which are detailed below.
Liquidity Curves
A liquidity curve is the volume of shares quoted that is visible to the public in the top 10 tiers on either side of the order book.
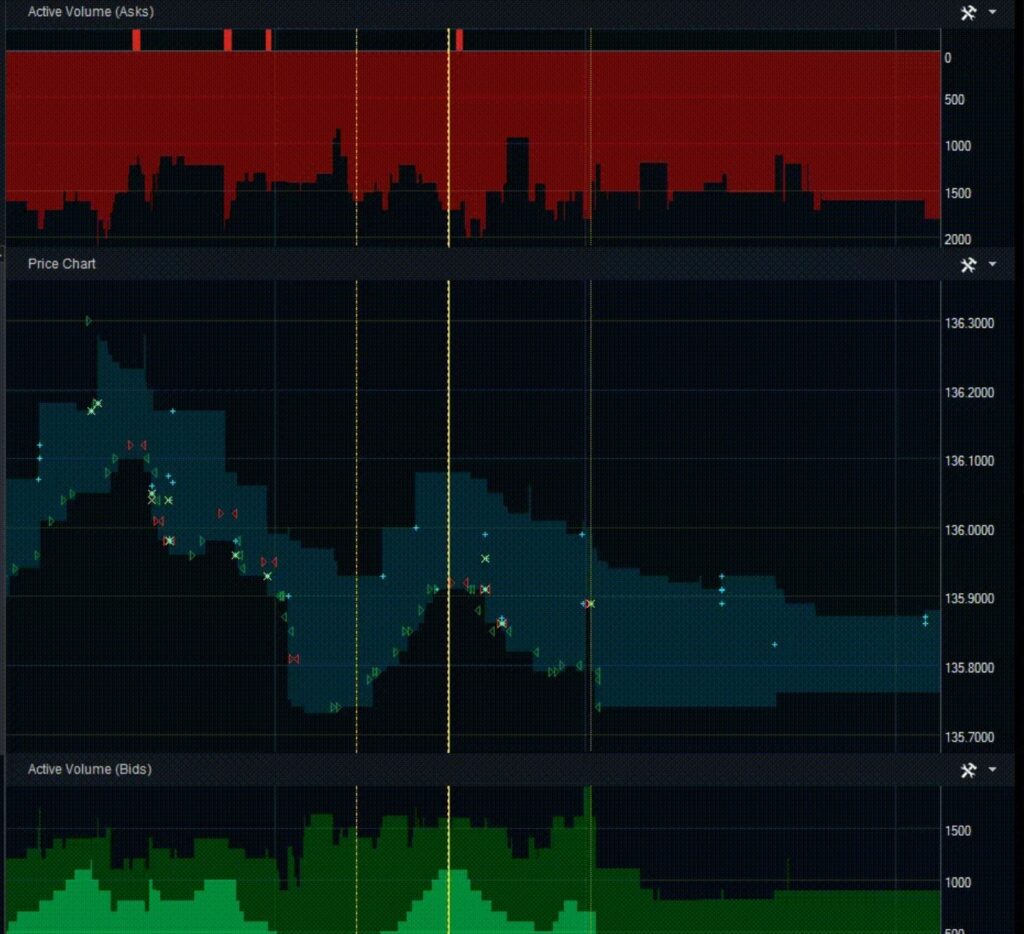
There are a few important distinctions made with different colors:
Dark green = buy volume of public order book
Dark red = sell volume of public order book
Light green = buy volume of individual firm or accounts
Light red = sell volume of individual firm or accounts
Position Indicators
The position curve represents the position of the firm as a whole or of an individual account.
Spread Indicators
The spread, also called the bid-ask spread, is the difference between the highest price that a buyer is willing to pay and the lowest price that a seller is willing to accept.
Shown in indigo in the graph: